Light Price - Luziérnagas |

|
価格 | 無料 | ダウンロード |
|
|---|---|---|---|---|
| ジャンル | ユーティリティ | |||
サイズ | 30.1MB | |||
| 開発者 | Juan Carlos Delgado | |||
| 順位 |
| |||
| リリース日 | 2022-12-01 17:00:00 | 評価 | 評価が取得できませんでした。 | |
| 互換性 | iOS 13.0以降が必要です。 iPhone、iPad および iPod touch 対応。 | |||
We provide information on both the voluntary price for the small consumer (PVPC) and the intraday price (SPOT) in the free market, both measured hour by hour.
For this purpose, we provide you with different visual components (widgets) that will allow you to control in a very simple and intuitive way the prices of the day as well as the prices of the following day, from the time of their publication.
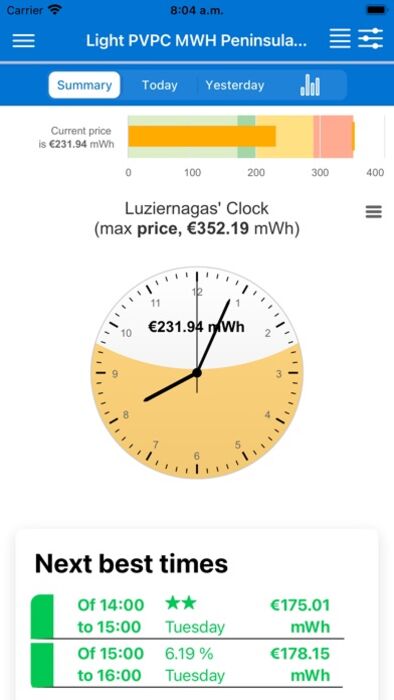
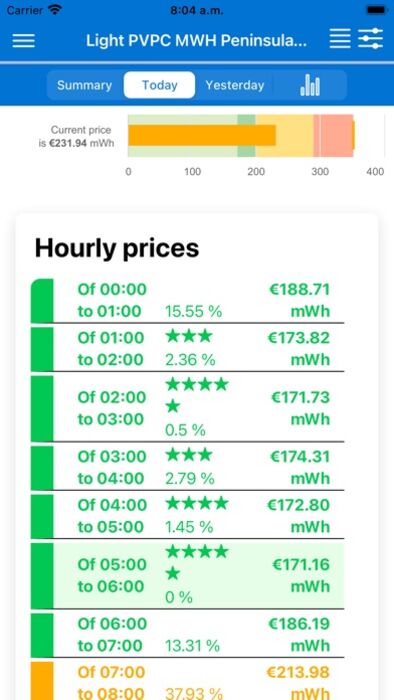
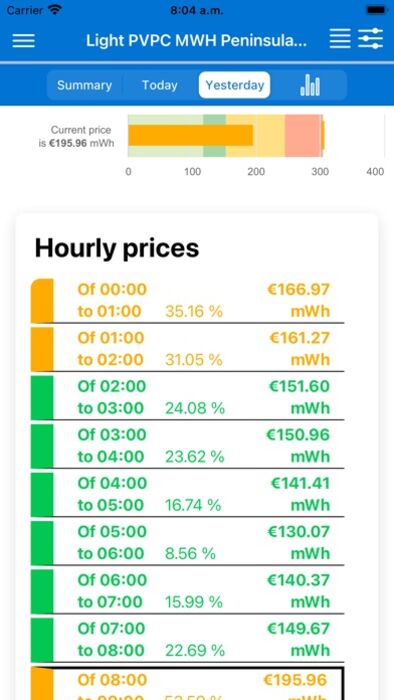
At a glance you will be able to locate the best price of the day, since the time will be highlighted with a green background and, in addition, with 5 green stars.
We recommend that you save energy by running your appliances at the times of day marked with stars (you will see them marked from 1 to 5 stars).
With the maximum/minimum widget you will be able to know the best price, the worst price and the average price of the day and the time when they will occur.
You will also be able to configure a widget that will allow you to quickly see the next best times and the next worst times, so that you can organize yourself quickly and easily.
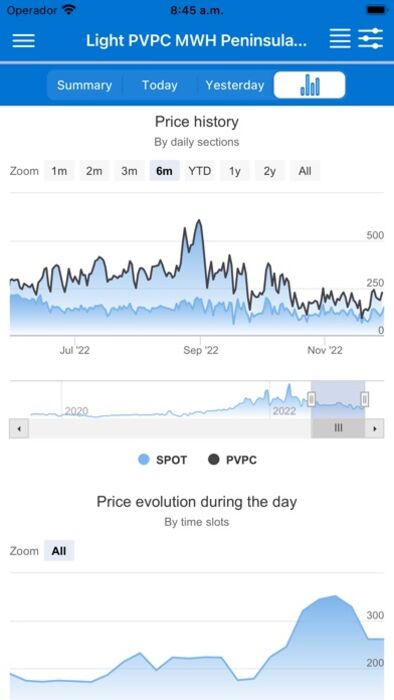
You can consult the daily evolution of the price in the form of a graph. You can also see the entire price history, comparing the PVPC price and the SPOT price so that you can easily see how they evolve with respect to each other.
Graphs in the form of a thermometer and in the form of a clock to see the current price in a simple and very visual way.
更新履歴
We incorporate the gas prices corresponding to the rate of last resort (TUR) as well as graphs and monthly averages for periods P1, P2 and P3, in PVPC electricity rates. The TUR rates of the neighboring communities (from TUR 4 to TUR 11) are also incorporated. You can also check the self-consumption price of electricity and the gas cap.
For this purpose, we provide you with different visual components (widgets) that will allow you to control in a very simple and intuitive way the prices of the day as well as the prices of the following day, from the time of their publication.
At a glance you will be able to locate the best price of the day, since the time will be highlighted with a green background and, in addition, with 5 green stars.
We recommend that you save energy by running your appliances at the times of day marked with stars (you will see them marked from 1 to 5 stars).
With the maximum/minimum widget you will be able to know the best price, the worst price and the average price of the day and the time when they will occur.
You will also be able to configure a widget that will allow you to quickly see the next best times and the next worst times, so that you can organize yourself quickly and easily.
You can consult the daily evolution of the price in the form of a graph. You can also see the entire price history, comparing the PVPC price and the SPOT price so that you can easily see how they evolve with respect to each other.
Graphs in the form of a thermometer and in the form of a clock to see the current price in a simple and very visual way.
更新履歴
We incorporate the gas prices corresponding to the rate of last resort (TUR) as well as graphs and monthly averages for periods P1, P2 and P3, in PVPC electricity rates. The TUR rates of the neighboring communities (from TUR 4 to TUR 11) are also incorporated. You can also check the self-consumption price of electricity and the gas cap.
ブログパーツ第二弾を公開しました!ホームページでアプリの順位・価格・周辺ランキングをご紹介頂けます。
ブログパーツ第2弾!
アプリの周辺ランキングを表示するブログパーツです。価格・順位共に自動で最新情報に更新されるのでアプリの状態チェックにも最適です。
ランキング圏外の場合でも周辺ランキングの代わりに説明文を表示にするので安心です。
サンプルが気に入りましたら、下に表示されたHTMLタグをそのままページに貼り付けることでご利用頂けます。ただし、一般公開されているページでご使用頂かないと表示されませんのでご注意ください。
幅200px版
幅320px版
お気に入りのアプリをご紹介頂くためのブログパーツです。アプリの価格や順位表示は毎日自動更新♪
サンプルが気に入りましたら、下に表示されたHTMLタグをそのままページに貼り付けることでご利用頂けます。
※配信を停止させていただく可能性もございますので、タグの改変はご遠慮ください。

Now Loading...

「iPhone & iPad アプリランキング」は、最新かつ詳細なアプリ情報をご紹介しているサイトです。
お探しのアプリに出会えるように様々な切り口でページをご用意しております。
「メニュー」よりぜひアプリ探しにお役立て下さい。
Presents by $$308413110 スマホからのアクセスにはQRコードをご活用ください。 →
Now loading...