VisualAudio Real Time Audio Spectrum Analyzer |
| この情報はストアのものより古い可能性がございます。 | ||||
| 価格 | 無料 | ダウンロード |
||
|---|---|---|---|---|
| ジャンル | ユーティリティ | |||
サイズ | 43.8MB | |||
| 開発者 | Now Instruments and Software, Inc. | |||
| 順位 |
| |||
| リリース日 | 2016-03-31 10:18:33 | 評価 | 評価が取得できませんでした。 | |
| 互換性 | iOS 6.0以降が必要です。 iPhone、iPad および iPod touch 対応。 | |||
VisualAudio is an acoustic analysis tool for science and engineering applications where quantitative frequency and level data are needed. In real-time analysis mode it works as both a spectrum analyzer and decibel meter. Audio samples can also be recorded and reviewed for later analysis. Raw and analyzed data, plus uncompressed audio, can be exported via email for outside analysis.
Here are the tools offered by VisualAudio:
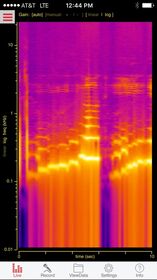
Live Display: Real-time frequency analysis via FFT (fast Fourier transform) can be visualized with either a power spectrum or rolling spectrogram. The time evolution of SPL (sound pressure level) is displayed, along with tools to calibrate your microphone.
Acquisition: Record audio samples at up to 48 kHz sample rates with timed acquisitions using either the built-in or an external microphone.
Data Storage: Audio samples are stored on the device, with date and time stamp for later retrieval. Recordings can be named for easy identification.
Analysis: Each sound recording can be analyzed to see the overall spectrum analysis, plus the evolution of the decibel level. Power spectrum, sound level, and raw data are displayed in graphical and report format. Also replay an audio sample to see the real-time audio spectrogram, power spectrum, and level for recorded data.
Data Export: Users can email raw or processed data in text (csv or tab-delimited) or MATLAB format. Recorded samples can also be exported as an uncompressed audio (WAV) file.
With VisualAudio, you can explore the world of sound. Visualize and analyze sounds from musical instruments and vibrational resonances. Measure overtone series and harmonics. Explore phonetics and spoken words, measure the frequency response of audio equipment, or analyze animal and bird sounds.
更新履歴
- Graph presentation and resolution improvements.
ブログパーツ第二弾を公開しました!ホームページでアプリの順位・価格・周辺ランキングをご紹介頂けます。
ブログパーツ第2弾!
アプリの周辺ランキングを表示するブログパーツです。価格・順位共に自動で最新情報に更新されるのでアプリの状態チェックにも最適です。
ランキング圏外の場合でも周辺ランキングの代わりに説明文を表示にするので安心です。
サンプルが気に入りましたら、下に表示されたHTMLタグをそのままページに貼り付けることでご利用頂けます。ただし、一般公開されているページでご使用頂かないと表示されませんのでご注意ください。
幅200px版
幅320px版
Now Loading...

「iPhone & iPad アプリランキング」は、最新かつ詳細なアプリ情報をご紹介しているサイトです。
お探しのアプリに出会えるように様々な切り口でページをご用意しております。
「メニュー」よりぜひアプリ探しにお役立て下さい。
Presents by $$308413110 スマホからのアクセスにはQRコードをご活用ください。 →
Now loading...


