Wildfire Info |
| この情報はストアのものより古い可能性がございます。 | ||||
| 価格 | 無料 | ダウンロード |
||
|---|---|---|---|---|
| ジャンル | 天気 | |||
サイズ | 18.3MB | |||
| 開発者 | David Gross | |||
| 順位 |
| |||
| リリース日 | 2016-07-14 10:11:07 | 評価 | 評価が取得できませんでした。 | |
| 互換性 | iOS 11.0以降が必要です。 iPhone、iPad および iPod touch 対応。 | |||
Browse current wildfire and prescribed burn activity throughout most of the world, including the USA, Canada, Europe, Australia, and more.
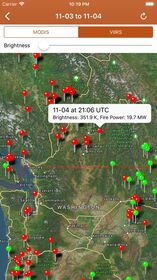
Thermal hotspot maps by region show wildfire activity in the past 48 hours from the NASA MODIS and VIIRS satellite instruments. Tap a pin to show detailed hotspot info including fire radiance power and brightness temperature. All data is timestamped in UTC. Different days in the 48-hour window are broken up with red and green pins for easy viewing.
InciWeb & CAL FIRE active fire maps: tap a marker on these maps to go to the corresponding official incident webpage.
Easy access to the corresponding InciWeb Incident or Article webpage in an embedded Safari View.
The InciWeb Incidents feed is categorized by state and is searchable. The InciWeb Articles feed is in chronological order, with incidents tagged by state, and is also searchable.
Tap a fire in the InciWeb Incidents Feed to zoom to it with the MODIS or VIIRS 24-hour map.
There is a section for wildfire-related US government Twitter accounts, sorted into national and state sources.
View current infrared GeoMAC Active Wildfire Perimeters data. All perimeters are selectable from a national map.
Information is posted as soon as it becomes available from GeoMAC, NASA, InciWeb, and CAL FIRE.
This app is not affiliated with any government agency.
There is a fixed banner ad from Google on the bottom of some content.
更新履歴
- Fix for MODIS/VIIRS thermal hotspot map color-coding bug. Red pins are UTC current day. Green pins are UTC prior day. Prior to this fix, there was some incorrect color mixing.
ブログパーツ第二弾を公開しました!ホームページでアプリの順位・価格・周辺ランキングをご紹介頂けます。
ブログパーツ第2弾!
アプリの周辺ランキングを表示するブログパーツです。価格・順位共に自動で最新情報に更新されるのでアプリの状態チェックにも最適です。
ランキング圏外の場合でも周辺ランキングの代わりに説明文を表示にするので安心です。
サンプルが気に入りましたら、下に表示されたHTMLタグをそのままページに貼り付けることでご利用頂けます。ただし、一般公開されているページでご使用頂かないと表示されませんのでご注意ください。
幅200px版
幅320px版
Now Loading...

「iPhone & iPad アプリランキング」は、最新かつ詳細なアプリ情報をご紹介しているサイトです。
お探しのアプリに出会えるように様々な切り口でページをご用意しております。
「メニュー」よりぜひアプリ探しにお役立て下さい。
Presents by $$308413110 スマホからのアクセスにはQRコードをご活用ください。 →
Now loading...


