VoxMetria |
| この情報はストアのものより古い可能性がございます。 | ||||
| 価格 | 15000円 | ダウンロード |
||
|---|---|---|---|---|
| ジャンル | メディカル | |||
サイズ | 3.3MB | |||
| 開発者 | CTS Informatica | |||
| 順位 |
| |||
| リリース日 | 2014-03-01 11:48:48 | 評価 | 評価が取得できませんでした。 | |
| 互換性 | iOS 9.3以降が必要です。 iPhone、iPad および iPod touch 対応。 | |||
VoxMetria - Vocal Quality is designed for Speech-Language Pathologists to analyze voice through a phonatory deviation graph showing voice deviation.
Phonatory Deviation Diagram is a simple and straightforward graph, which ranks the client’s production inside a normal or altered area by means of a little red circle, which indicates the average value and smaller green circles, which show the irregularity distribution, particularly concerning phonatory deviation; it enables brief and precise information on the quality of the client’s production.
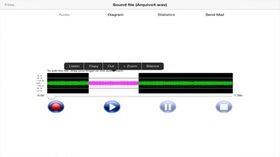
You can record a sound and edit the sound file easily!
The statistics screen displays the acoustic analysis values of fundamental frequency, jitter, shimmer, irregularity, noise rate and GNE (Glottal to Noise Excitation).
It´s possible to send the results by e-mail (sound file, Phonatory Deviation Diagram and Statistics) or export the sound file through iTunes.
Note: To use the Vocal Quality Functions, record a sustained vowel for some seconds (preferencially the /e/ vowel)
Coordination:
Dr. Mara Behlau, pDH
*Phonatory deviation Diagram is based on hoarseness diagram method developed by Dr. D. Michaelis (pHD thesis). References:
1.[Kasuya et al.] Novel acoustic measurements of jitter and shimmer characteristics from pathological voice, Eurospeech '93, p. 1973-1976 (1993)
2.[Michaelis et al. 1998] JASA 103(3), pp.1628-1639 (1998)
3.[Fröhlich et al. 2000] JSLHR 43, pp.706-720 (2000)
更新履歴
update iOS 15.
ブログパーツ第二弾を公開しました!ホームページでアプリの順位・価格・周辺ランキングをご紹介頂けます。
ブログパーツ第2弾!
アプリの周辺ランキングを表示するブログパーツです。価格・順位共に自動で最新情報に更新されるのでアプリの状態チェックにも最適です。
ランキング圏外の場合でも周辺ランキングの代わりに説明文を表示にするので安心です。
サンプルが気に入りましたら、下に表示されたHTMLタグをそのままページに貼り付けることでご利用頂けます。ただし、一般公開されているページでご使用頂かないと表示されませんのでご注意ください。
幅200px版
幅320px版
Now Loading...

「iPhone & iPad アプリランキング」は、最新かつ詳細なアプリ情報をご紹介しているサイトです。
お探しのアプリに出会えるように様々な切り口でページをご用意しております。
「メニュー」よりぜひアプリ探しにお役立て下さい。
Presents by $$308413110 スマホからのアクセスにはQRコードをご活用ください。 →
Now loading...


