Breakout Charts |
| このアプリは現在ストアで閲覧することができません。 | ||||


|
価格 | 3200円 | ダウンロード |
|
|---|---|---|---|---|
| ジャンル | ファイナンス | |||
サイズ | 22.0MB | |||
| 開発者 | Yue Qi | |||
| 順位 |
| |||
| リリース日 | 2013-11-11 09:07:15 | 評価 | 評価が取得できませんでした。 | |
| 互換性 | iOS 8.4以降が必要です。 iPhone、iPad および iPod touch 対応。 | |||
|
||||
Breakout Charts (v2.0) by Screenulator.com ®
Breakout Charts screens for high potential breakout chart patterns for over 19,000 stocks world wide!
Powered by famous Screenulator © Chart pattern recognition engine, two main categories of breakout chart patterns are scanned daily for over 12 worldwide stock exchanges.
Flat Channel Breakouts:
Flat Channel Breakout pattern is characterized with a long period of narrow trading range followed by sudden increase in price and volume, effectively breaking out of the narrow trading range. This kind of pattern has been described in books such as "How I Made $2 Million in the Stock Market by Nicolas Darvas", and "Stan Weinstein, Stan Weinstein's Secrets For Profiting in Bull and Bear Markets".
Channel period of 100, 200 and 400 trading days are screened each day by the app, and breakout is detected when the high volume and high percentage move criteria are met. Usually the longer time frame patterns yields more potential gain, but rare in occurance.
Rounding Bottoms:
Rouding Bottom is a "U" shaped pattern characterized by a descend from a high point to a flat bottom, followed by a sudden breakout usually accompanied by a news or market events, and resulting a prolonged "rounding up" uptrend, sometimes even far exceeds the previous high. This is usually a long term pattern with the bottom section lasting more than 100 days. In Screenulator, we scan patterns between 100 to 1000 day time span. It is usually a high profitable pattern, but rare in occurance.
There are two Rounding Bottom patterns: RB-Potential and RB-Complete. Because of the rarity of this pattern, Screenulator also screens for potential Rounding Bottom (RB-Potential) patterns which have not reached its the previous high (thus incomplete), but only started the initial breakout. The "Rounding Bottom Potential" therefore has more daily qualifiers than "Rounding Bottom Complete", and more profit potentials, albeit with less success rate.
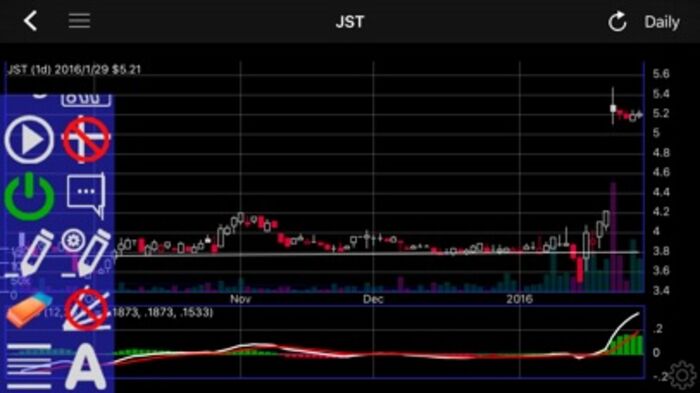
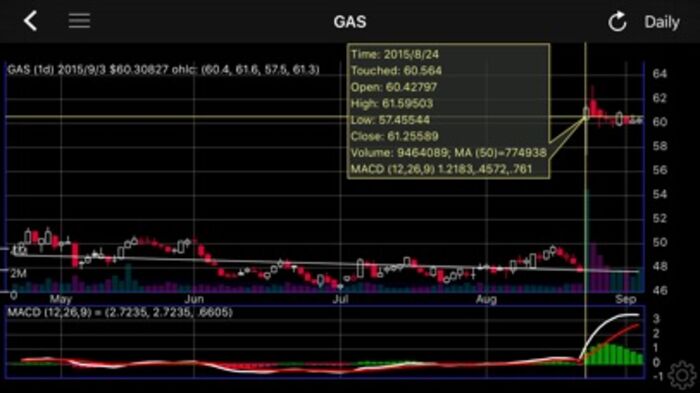
Quotes and Charts:
The app also contains the industry leading charts from Interactive Stock Charts ™, with touch info display, scroll, panning, pinch zoom time frame changes. Various TA indicator supports: MACD, RSI, CCI, SMA, EMA, Bollinger, Keltner band, Aroon, Donchian Channel, Stochastic, Ultimate oscillator, Ichimoku cloud and others will be added upon request. Intraday 1, 5, 10, 30 minute charts. EOD charts range from 6 month to over 10 years of historical data for over 19000 stock symbols.
Supported markets (over 15,000 stock symbols):
- United States: NASDAQ, NYSE, AMEX, Canada: TSX
- Brazil: San Paolo
- Asia: HKEX, Australia, New Zealand, India (NSE), JKSE, SGX (Singapore), Shenzhen (China)
- Europe: London, Paris, Brussels, Amsterdam, Milan
- Forex
更新履歴
Support list view in portfolio
Improve stability (bug fixes)
CCI indicator intraday
Breakout Charts screens for high potential breakout chart patterns for over 19,000 stocks world wide!
Powered by famous Screenulator © Chart pattern recognition engine, two main categories of breakout chart patterns are scanned daily for over 12 worldwide stock exchanges.
Flat Channel Breakouts:
Flat Channel Breakout pattern is characterized with a long period of narrow trading range followed by sudden increase in price and volume, effectively breaking out of the narrow trading range. This kind of pattern has been described in books such as "How I Made $2 Million in the Stock Market by Nicolas Darvas", and "Stan Weinstein, Stan Weinstein's Secrets For Profiting in Bull and Bear Markets".
Channel period of 100, 200 and 400 trading days are screened each day by the app, and breakout is detected when the high volume and high percentage move criteria are met. Usually the longer time frame patterns yields more potential gain, but rare in occurance.
Rounding Bottoms:
Rouding Bottom is a "U" shaped pattern characterized by a descend from a high point to a flat bottom, followed by a sudden breakout usually accompanied by a news or market events, and resulting a prolonged "rounding up" uptrend, sometimes even far exceeds the previous high. This is usually a long term pattern with the bottom section lasting more than 100 days. In Screenulator, we scan patterns between 100 to 1000 day time span. It is usually a high profitable pattern, but rare in occurance.
There are two Rounding Bottom patterns: RB-Potential and RB-Complete. Because of the rarity of this pattern, Screenulator also screens for potential Rounding Bottom (RB-Potential) patterns which have not reached its the previous high (thus incomplete), but only started the initial breakout. The "Rounding Bottom Potential" therefore has more daily qualifiers than "Rounding Bottom Complete", and more profit potentials, albeit with less success rate.
Quotes and Charts:
The app also contains the industry leading charts from Interactive Stock Charts ™, with touch info display, scroll, panning, pinch zoom time frame changes. Various TA indicator supports: MACD, RSI, CCI, SMA, EMA, Bollinger, Keltner band, Aroon, Donchian Channel, Stochastic, Ultimate oscillator, Ichimoku cloud and others will be added upon request. Intraday 1, 5, 10, 30 minute charts. EOD charts range from 6 month to over 10 years of historical data for over 19000 stock symbols.
Supported markets (over 15,000 stock symbols):
- United States: NASDAQ, NYSE, AMEX, Canada: TSX
- Brazil: San Paolo
- Asia: HKEX, Australia, New Zealand, India (NSE), JKSE, SGX (Singapore), Shenzhen (China)
- Europe: London, Paris, Brussels, Amsterdam, Milan
- Forex
更新履歴
Support list view in portfolio
Improve stability (bug fixes)
CCI indicator intraday
ブログパーツ第二弾を公開しました!ホームページでアプリの順位・価格・周辺ランキングをご紹介頂けます。
ブログパーツ第2弾!
アプリの周辺ランキングを表示するブログパーツです。価格・順位共に自動で最新情報に更新されるのでアプリの状態チェックにも最適です。
ランキング圏外の場合でも周辺ランキングの代わりに説明文を表示にするので安心です。
サンプルが気に入りましたら、下に表示されたHTMLタグをそのままページに貼り付けることでご利用頂けます。ただし、一般公開されているページでご使用頂かないと表示されませんのでご注意ください。
幅200px版
幅320px版
お気に入りのアプリをご紹介頂くためのブログパーツです。アプリの価格や順位表示は毎日自動更新♪
サンプルが気に入りましたら、下に表示されたHTMLタグをそのままページに貼り付けることでご利用頂けます。
※配信を停止させていただく可能性もございますので、タグの改変はご遠慮ください。

Now Loading...

「iPhone & iPad アプリランキング」は、最新かつ詳細なアプリ情報をご紹介しているサイトです。
お探しのアプリに出会えるように様々な切り口でページをご用意しております。
「メニュー」よりぜひアプリ探しにお役立て下さい。
Presents by $$308413110 スマホからのアクセスにはQRコードをご活用ください。 →
Now loading...