Vernier Graphical Analysis GW |
| この情報はストアのものより古い可能性がございます。 | ||||
|
価格 | 無料 | ダウンロード |
|
|---|---|---|---|---|
| ジャンル | 教育 | |||
サイズ | 19.6MB | |||
| 開発者 | Vernier Software & Technology | |||
| 順位 |
| |||
| リリース日 | 2012-05-06 22:59:46 | 評価 |
|
|
| 互換性 | iOS 11.0以降が必要です。 iPhone、iPad および iPod touch 対応。 | |||
 (1人)
(1人)
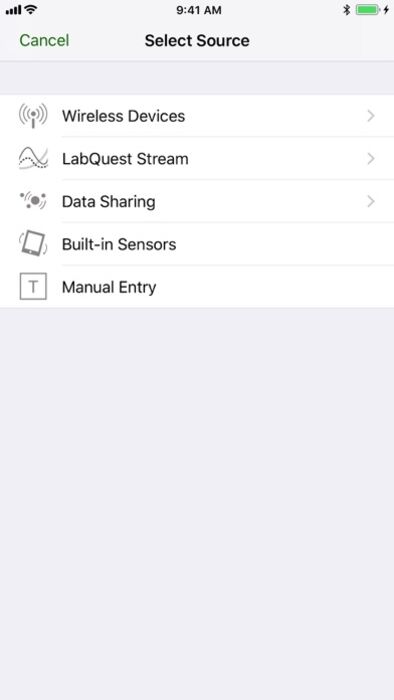
Graphical Analysis™ GW is a tool for science students to collect, graph, and analyze data from Vernier Go Wireless® sensors.
Sensor data-collection support:
• Vernier Go Wireless® Temp and Go Wireless pH sensors
• Vernier Go Wireless Heart Rate and Go Wireless Exercise Heart Rate monitors
• Vernier LabQuest® sensors used with Go Wireless Link or LabQuest Stream interfaces
• Basic support for some Vernier Go Direct® Sensors
• NODE (by Variable Inc.) sensor support
Additional experiment options:
• Data Sharing via Wi-Fi connection to LabQuest 2 or Logger Pro® 3
• Built-in Sensors (accelerometers)
• Manual Entry
Note: Sensor data collection and Data Sharing require the purchase of hardware from Vernier Software & Technology. Built-in sensor and manual entry of data can be performed without a hardware purchase. For more information on Data Sharing, visit http://www.vernier.com/css
Key Features - Data Collection
• Multi-sensor data-collection support
• Time Based, Event Based, and Drop Counting data-collection modes
• Configurable data-collection rate and duration for time-based data collection
• Sensor calibrations
• Option to zero and reverse sensor readings
• Graph match feature for use with motion detectors
• Manual entry of data from keyboard and clipboard
Key Features - Data Analysis
• Display one, two, or three graphs simultaneously
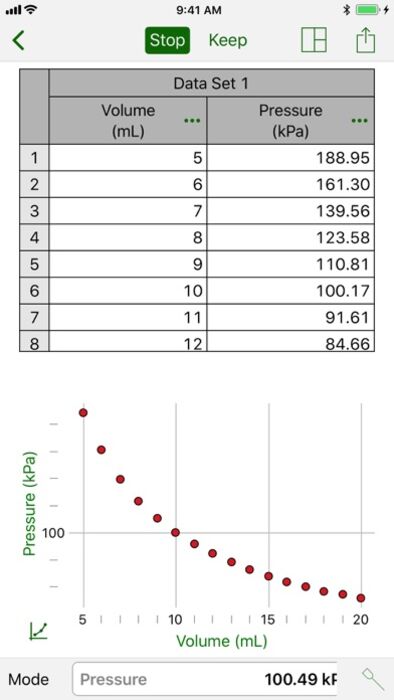
• View data in a table or show a graph and table side-by-side
• Draw Predictions on a graph to uncover misconceptions
• Examine, interpolate/extrapolate, and select data
• Apply Statistics calculations to find mean, min, max, and standard deviation
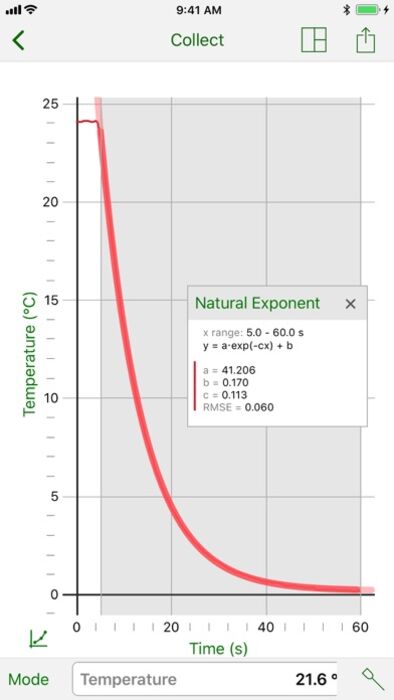
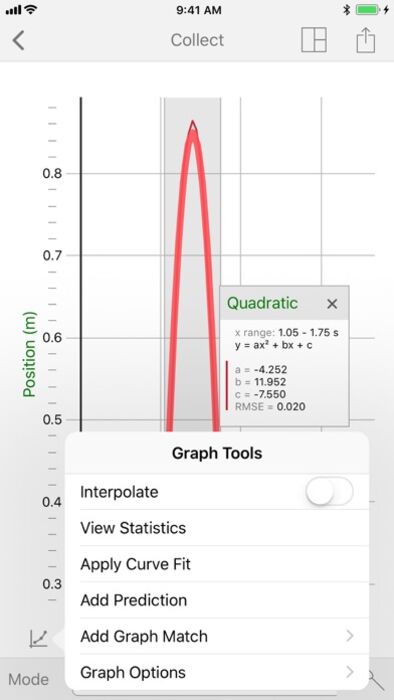
• Perform curve fits, including linear, quadratic, natural exponent, and more
• Add calculated columns based on existing data to linearize data or investigate related concepts
• Pinch to scale graphs
Key Features - Collaboration and Sharing
• Add graph titles
• Export graphs and data for printing and inclusion in lab reports
• Export data in .CSV format for analysis of data in spreadsheet software such as Excel®, Google Sheets™, and Numbers®
Vernier Software & Technology has over 35 years of experience in providing effective learning resources for understanding experimental data in science and math classrooms. Graphical Analysis GW is a part of the extensive system of sensors, interfaces, and data-collection software from Vernier for science and STEM education.
更新履歴
• Support for iOS 13
• Various bug fixes and improvements
Sensor data-collection support:
• Vernier Go Wireless® Temp and Go Wireless pH sensors
• Vernier Go Wireless Heart Rate and Go Wireless Exercise Heart Rate monitors
• Vernier LabQuest® sensors used with Go Wireless Link or LabQuest Stream interfaces
• Basic support for some Vernier Go Direct® Sensors
• NODE (by Variable Inc.) sensor support
Additional experiment options:
• Data Sharing via Wi-Fi connection to LabQuest 2 or Logger Pro® 3
• Built-in Sensors (accelerometers)
• Manual Entry
Note: Sensor data collection and Data Sharing require the purchase of hardware from Vernier Software & Technology. Built-in sensor and manual entry of data can be performed without a hardware purchase. For more information on Data Sharing, visit http://www.vernier.com/css
Key Features - Data Collection
• Multi-sensor data-collection support
• Time Based, Event Based, and Drop Counting data-collection modes
• Configurable data-collection rate and duration for time-based data collection
• Sensor calibrations
• Option to zero and reverse sensor readings
• Graph match feature for use with motion detectors
• Manual entry of data from keyboard and clipboard
Key Features - Data Analysis
• Display one, two, or three graphs simultaneously
• View data in a table or show a graph and table side-by-side
• Draw Predictions on a graph to uncover misconceptions
• Examine, interpolate/extrapolate, and select data
• Apply Statistics calculations to find mean, min, max, and standard deviation
• Perform curve fits, including linear, quadratic, natural exponent, and more
• Add calculated columns based on existing data to linearize data or investigate related concepts
• Pinch to scale graphs
Key Features - Collaboration and Sharing
• Add graph titles
• Export graphs and data for printing and inclusion in lab reports
• Export data in .CSV format for analysis of data in spreadsheet software such as Excel®, Google Sheets™, and Numbers®
Vernier Software & Technology has over 35 years of experience in providing effective learning resources for understanding experimental data in science and math classrooms. Graphical Analysis GW is a part of the extensive system of sensors, interfaces, and data-collection software from Vernier for science and STEM education.
更新履歴
• Support for iOS 13
• Various bug fixes and improvements
ブログパーツ第二弾を公開しました!ホームページでアプリの順位・価格・周辺ランキングをご紹介頂けます。
ブログパーツ第2弾!
アプリの周辺ランキングを表示するブログパーツです。価格・順位共に自動で最新情報に更新されるのでアプリの状態チェックにも最適です。
ランキング圏外の場合でも周辺ランキングの代わりに説明文を表示にするので安心です。
サンプルが気に入りましたら、下に表示されたHTMLタグをそのままページに貼り付けることでご利用頂けます。ただし、一般公開されているページでご使用頂かないと表示されませんのでご注意ください。
幅200px版
幅320px版
お気に入りのアプリをご紹介頂くためのブログパーツです。アプリの価格や順位表示は毎日自動更新♪
サンプルが気に入りましたら、下に表示されたHTMLタグをそのままページに貼り付けることでご利用頂けます。
※配信を停止させていただく可能性もございますので、タグの改変はご遠慮ください。

Now Loading...

「iPhone & iPad アプリランキング」は、最新かつ詳細なアプリ情報をご紹介しているサイトです。
お探しのアプリに出会えるように様々な切り口でページをご用意しております。
「メニュー」よりぜひアプリ探しにお役立て下さい。
Presents by $$308413110 スマホからのアクセスにはQRコードをご活用ください。 →
Now loading...