Typhoon Tracker (台風 태풍 台风) |
| このアプリは現在ストアで閲覧することができません。 | ||||

|
価格 | 無料 | ダウンロード |
|
|---|---|---|---|---|
| ジャンル | 天気 | |||
サイズ | 14.0MB | |||
| 開発者 | LW Brands, LLC | |||
| 順位 |
| |||
| リリース日 | 2018-08-03 21:05:28 | 評価 |
|
|
| 互換性 | iOS 8.0以降が必要です。 iPhone、iPad および iPod touch 対応。 | |||
|
||||
 (1人)
(1人) (15人)
(15人)
* NOAA Typhoon Tracker Data *
** 台風 태풍 台风 **
MAIN FEATURES INCLUDE:
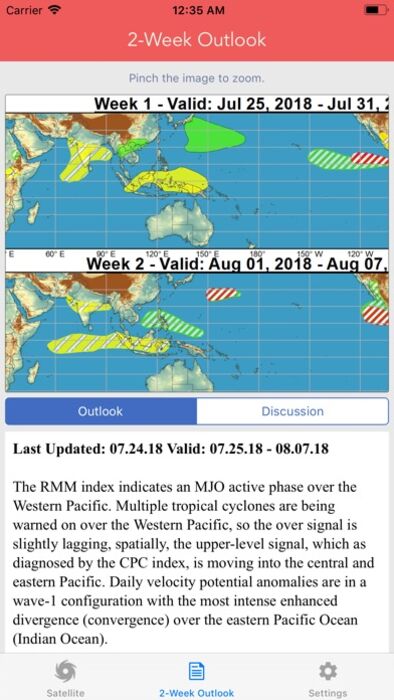
* 2-week Tropical Storm Outlook (Global)
* Himawari-8 Satellite Imagery (10 filters)
- Visible
- Short IR
- Water Vapor
- RGB
- AVN
- Dvorak
- Funktop
- Rainbow
- RBTop
By far the fastest, most convenient way to access Typhoon Tracking data. The app displays detailed satellite imagery animations, allowing you to track the storm using the most recent observations.
** Satellite Filter Descriptions **
-- Funktop --
Created by Ted Funk and emphasizes intense areas of precipitation.
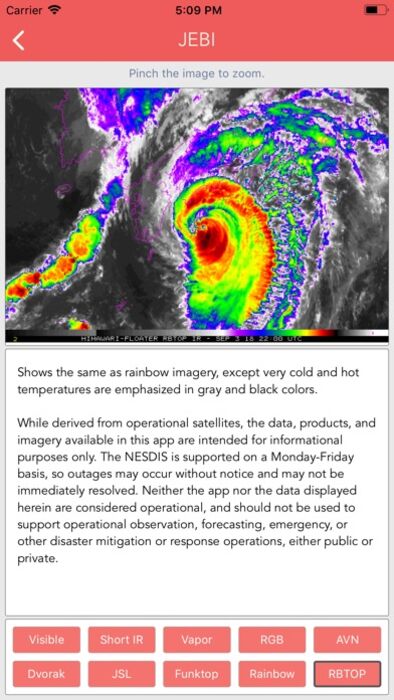
-- RBTOP --
Shows the same as rainbow imagery, except very cold and hot temperatures are emphasized in gray and black colors.
-- Rainbow --
Shows cloud temperature with the entire visible specturm.
-- JSL --
Developed by Jim Lynch. Used to bring out low level and high level clouds in tropical cyclones.
-- AVN --
Shows cloud temperature in aviation colors.\n\nWhile derived from operational satellites, the data, products, and imagery available in this app are intended for informational purposes only.
-- RBG --
This image is generated using a combination of Visible and IR using a three channel technique to form a Red/Green/Blue false color image.
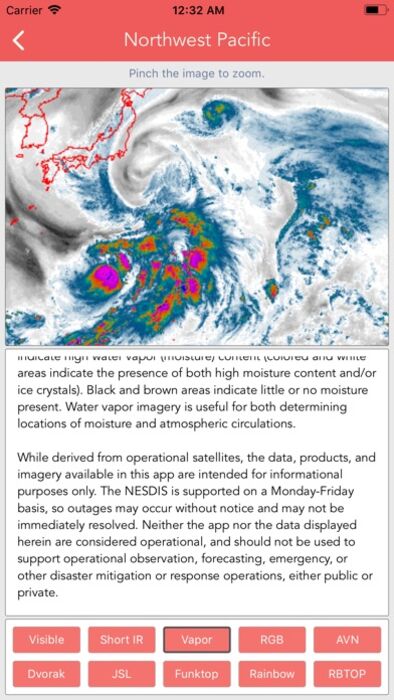
-- Water Vapor --
This image is taken using a wavelength sensitive to the content of water vapor in the atmosphere. Bright and colored areas indicate high water vapor (moisture) content (colored and white areas indicate the presence of both high moisture content and/or ice crystals). Black and brown areas indicate little or no moisture present. Water vapor imagery is useful for both determining locations of moisture and atmospheric circulations.
--Short Wave IR --
Channel 2 Shortwave Infrared imagery - Shortwave, sometimes considered 'night visible'. This image is taken in the infrared band of light and show relative warmth of objects. Colder objects are brighter and warmer objects are darker. Lower layers of clouds, generally warmer and lower in altitude, are colored gray. Colder and generally higher clouds tops are highlighted in colors. Infrared imagery is useful for determining cloud features both at day and night
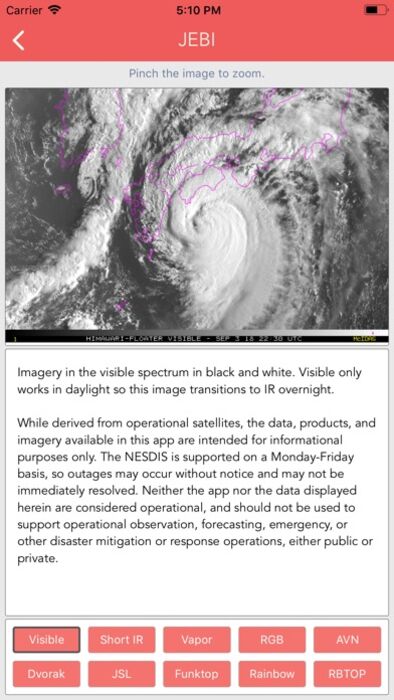
-- Visible --
Imagery in the visible spectrum in black and white. Visible only works in daylight so this image transitions to IR overnight.
-- Dvorak --
The Dvorak technique is a method using enhanced Infrared and/or visible satellite imagery to quantitatively estimate the intensity of a tropical system. Cloud patterns in satellite imagery normally show an indication of cyclogenesis before the storm reaches tropical storm intensity. Indications of continued development and/or weakening can also be found in the cloud features. Using these features, the pattern formed by the clouds of a tropical cyclone, expected systematic development, and a series of rules, an intensity analysis and forecast can be made. This information is then standardized into an intensity code.
更新履歴
+ Added storm intensity based on Dvorak technique
Thank you for the positive feedback!
** 台風 태풍 台风 **
MAIN FEATURES INCLUDE:
* 2-week Tropical Storm Outlook (Global)
* Himawari-8 Satellite Imagery (10 filters)
- Visible
- Short IR
- Water Vapor
- RGB
- AVN
- Dvorak
- Funktop
- Rainbow
- RBTop
By far the fastest, most convenient way to access Typhoon Tracking data. The app displays detailed satellite imagery animations, allowing you to track the storm using the most recent observations.
** Satellite Filter Descriptions **
-- Funktop --
Created by Ted Funk and emphasizes intense areas of precipitation.
-- RBTOP --
Shows the same as rainbow imagery, except very cold and hot temperatures are emphasized in gray and black colors.
-- Rainbow --
Shows cloud temperature with the entire visible specturm.
-- JSL --
Developed by Jim Lynch. Used to bring out low level and high level clouds in tropical cyclones.
-- AVN --
Shows cloud temperature in aviation colors.\n\nWhile derived from operational satellites, the data, products, and imagery available in this app are intended for informational purposes only.
-- RBG --
This image is generated using a combination of Visible and IR using a three channel technique to form a Red/Green/Blue false color image.
-- Water Vapor --
This image is taken using a wavelength sensitive to the content of water vapor in the atmosphere. Bright and colored areas indicate high water vapor (moisture) content (colored and white areas indicate the presence of both high moisture content and/or ice crystals). Black and brown areas indicate little or no moisture present. Water vapor imagery is useful for both determining locations of moisture and atmospheric circulations.
--Short Wave IR --
Channel 2 Shortwave Infrared imagery - Shortwave, sometimes considered 'night visible'. This image is taken in the infrared band of light and show relative warmth of objects. Colder objects are brighter and warmer objects are darker. Lower layers of clouds, generally warmer and lower in altitude, are colored gray. Colder and generally higher clouds tops are highlighted in colors. Infrared imagery is useful for determining cloud features both at day and night
-- Visible --
Imagery in the visible spectrum in black and white. Visible only works in daylight so this image transitions to IR overnight.
-- Dvorak --
The Dvorak technique is a method using enhanced Infrared and/or visible satellite imagery to quantitatively estimate the intensity of a tropical system. Cloud patterns in satellite imagery normally show an indication of cyclogenesis before the storm reaches tropical storm intensity. Indications of continued development and/or weakening can also be found in the cloud features. Using these features, the pattern formed by the clouds of a tropical cyclone, expected systematic development, and a series of rules, an intensity analysis and forecast can be made. This information is then standardized into an intensity code.
更新履歴
+ Added storm intensity based on Dvorak technique
Thank you for the positive feedback!
ブログパーツ第二弾を公開しました!ホームページでアプリの順位・価格・周辺ランキングをご紹介頂けます。
ブログパーツ第2弾!
アプリの周辺ランキングを表示するブログパーツです。価格・順位共に自動で最新情報に更新されるのでアプリの状態チェックにも最適です。
ランキング圏外の場合でも周辺ランキングの代わりに説明文を表示にするので安心です。
サンプルが気に入りましたら、下に表示されたHTMLタグをそのままページに貼り付けることでご利用頂けます。ただし、一般公開されているページでご使用頂かないと表示されませんのでご注意ください。
幅200px版
幅320px版
お気に入りのアプリをご紹介頂くためのブログパーツです。アプリの価格や順位表示は毎日自動更新♪
サンプルが気に入りましたら、下に表示されたHTMLタグをそのままページに貼り付けることでご利用頂けます。
※配信を停止させていただく可能性もございますので、タグの改変はご遠慮ください。
の詳細はiPhone & iPadアプリランキングで!")
Now Loading...

「iPhone & iPad アプリランキング」は、最新かつ詳細なアプリ情報をご紹介しているサイトです。
お探しのアプリに出会えるように様々な切り口でページをご用意しております。
「メニュー」よりぜひアプリ探しにお役立て下さい。
Presents by $$308413110 スマホからのアクセスにはQRコードをご活用ください。 →
Now loading...